PolyWorks|ReportLoop™는 사용자가 선호하는 보고 및 분석 솔루션에 지능형 3D 검사 데이터를 디지털 방식으로 직접 연결하여, 데이터 분석 전문가 팀이 풍부한 3D 측정 데이터를 제조 프로세스의 중심에서 효율적이고 경제적으로 활용할 수 있도록 지원합니다.

일상 업무에서 Excel의 강력함과 유연성을 활용하세요
Excel의 폭넓은 수학 및 차트 기능을 활용하여 검사 결과를 데이터 요약, 그래픽, 강력한 수학적 계산 및 자동화된 워크플로우로 전환하세요.
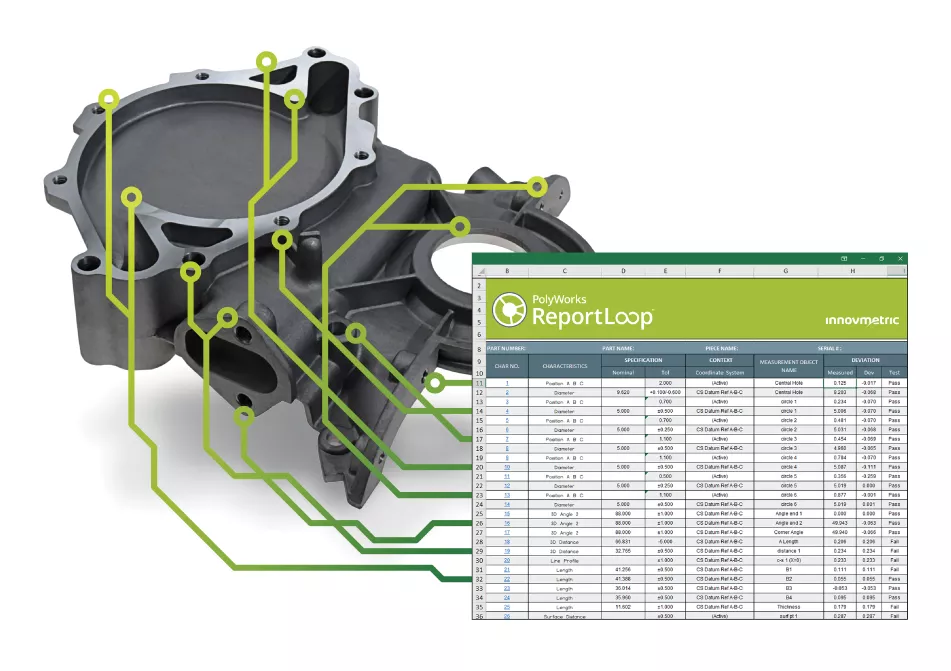
동적 3D 검사 데이터에 연결된 스프레드시트
Excel 스프레드시트 셀을 PolyWorks|Inspector™ 프로젝트 및 피스의 속성은 물론 컨트롤, 컨트롤 뷰, 테이블, 스냅샷과 같은 검사 결과에 디지털 방식으로 연결하여 전환 오류가 발생하지 않습니다.
자동 스프레드시트 업데이트
스프레드시트에 연결된 측정 데이터가 변경되면 PolyWorks|ReportLoop가 해당 스프레드시트 값을 자동으로 업데이트합니다.
두 가지 상호 연결 방식
실행중인 PolyWorks|Inspector 세션 또는 PolyWorks|DataLoop™ 서버에 연결하여 3D 검사 데이터에 액세스할 수 있습니다.
재사용 가능한 템플릿 만들기
Excel 스프레드시트를 미리 서식화하고, PolyWorks|ReportLoop 사용자 정의 수식을 삽입하여 정보가 풍부한 보고서 템플릿을 구성하세요.
이상적인 협동 팀워크
스마트한 3D 검사 데이터를 포함한 레포트 및 분석 결과를 동료와 공유하세요.
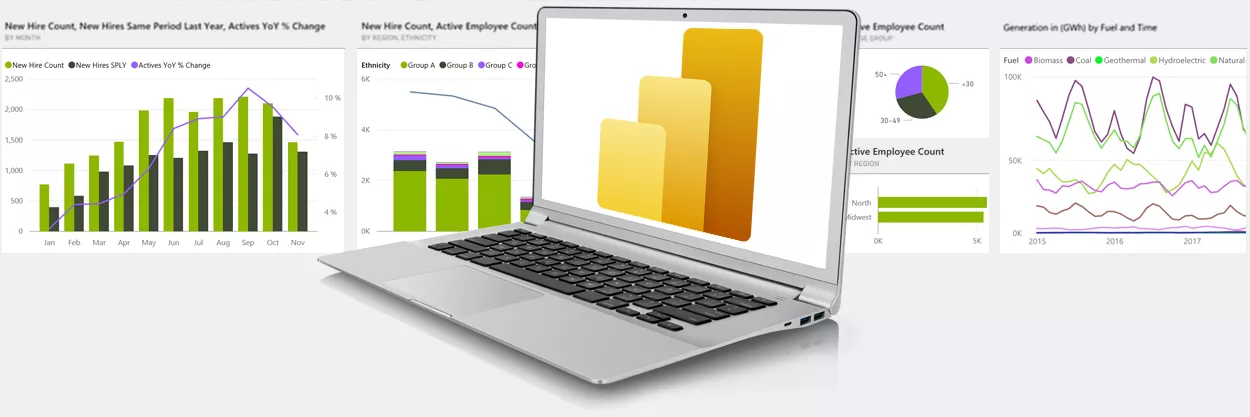
동적 3D 검사 데이터를 활용하여 Power BI의 분석 능력을 향상시키세요
3D 검사 데이터를 Power BI에 디지털 방식으로 통합하 항상 최신 상태로 유지되는 매력적인 대시보드와 이해하기 쉬운 보고서를 생성하고 게시하세요.
원활한 디지털 상호 연결
Power BI 내에서 PolyWorks|DataLoop 서버에 로그인하여 3D 측정 데이터를 디지털 방식으로 연동하세요.
고속 타겟 데이터 전송
필터와 Power BI의 쿼리 편집기를 사용하여 데이터 테이블을 구성하고 원하는 데이터를 지정한 뒤, 한 번의 클릭으로 원하는 데이터를 불러오세요.
모든 Power BI 기본 기능 제공
Power BI의 강력한 데이터 분석 및 시각화 도구를 활용하여 핵심 이해 관계자들에게 스마트한 치수 품질 요약 정보를 전달하세요.
자동 업데이트 서비스
데이터 새로 고침 일정을 설정하여 PolyWorks|DataLoop 서버에 주기적으로 재연결하여 게시된 Power BI 보고서를 최신 상태로 유지하세요.
기술 사양을 확인하세요